
Two attempts to model the World Cup knockout rounds
With the World Cup knockout rounds underway, it’s time for me to give an analysis of which team I think will hoist the Cup at Maracanã on July 13.
Since I don’t know that much about soccer, beyond what I hear from my fútbol-loving friends and from the commentary on these matches, I decided to turn to one thing I do a bit about: data. Particularly that from the group rounds, since that gives us the most-recent information from the teams’ on-field play.
Obviously, we could analyze the key particulars — wins, losses, draws, goals — and those would give us some moderately reasonable ideas of who might be coming in with a head of steam. But there’s a difference between Brazil’s 4-1 trouncing of hapless Cameroon (which finished with zero points) and France’s 5-2 blowout against Switzerland (which qualified as the group’s second seed).
To account for that, I created two comparators.
The synthetic criteria
Weighted Points is the number of points awarded for each result (3 for a win, 1 for a draw) multiplied by the respective opponent’s final point-total.
Weighted Goal Differential is the goal differential for a given game multiplied by the respective opponent’s final point-total.
Since Switzerland finished with 6 points in its group — it beat both Ecuador and Honduras — France would receive 18 Weighted Points (3 points for win x 6 Swiss points) and a Weighted Goal Differential of 18 (+3 GD x 6 Swiss points).
In that same game, Switzerland would receive 0 Weighted Points and would get a Weighted Goal Differential of -21 (-3 GD x 7 French points).
The data
Here is a table with each qualifier’s stats.
| Team | Pts | GD | GF | WPts | WGD |
| Brazil | 7 | 5 | 7 | 16 | 6 |
| Chile | 6 | 2 | 5 | 9 | -12 |
| Colombia | 9 | 7 | 9 | 24 | 18 |
| Uruguay | 6 | 0 | 4 | 12 | -10 |
| France | 7 | 6 | 8 | 22 | 18 |
| Nigeria | 4 | 0 | 3 | 10 | -6 |
| Germany | 7 | 5 | 7 | 25 | 20 |
| Algeria | 4 | 1 | 6 | 5 | -7 |
| Netherlands | 9 | 7 | 10 | 27 | 24 |
| Mexico | 7 | 3 | 4 | 16 | 6 |
| Costa Rica | 7 | 3 | 4 | 28 | 15 |
| Greece | 4 | -2 | 2 | 10 | -24 |
| Argentina | 9 | 3 | 6 | 24 | 8 |
| Switzerland | 6 | 1 | 7 | 12 | -17 |
| Belgium | 9 | 3 | 4 | 21 | 7 |
| USA | 4 | 0 | 4 | 7 | -6 |
Now, for the methods for comparison. I went with two.
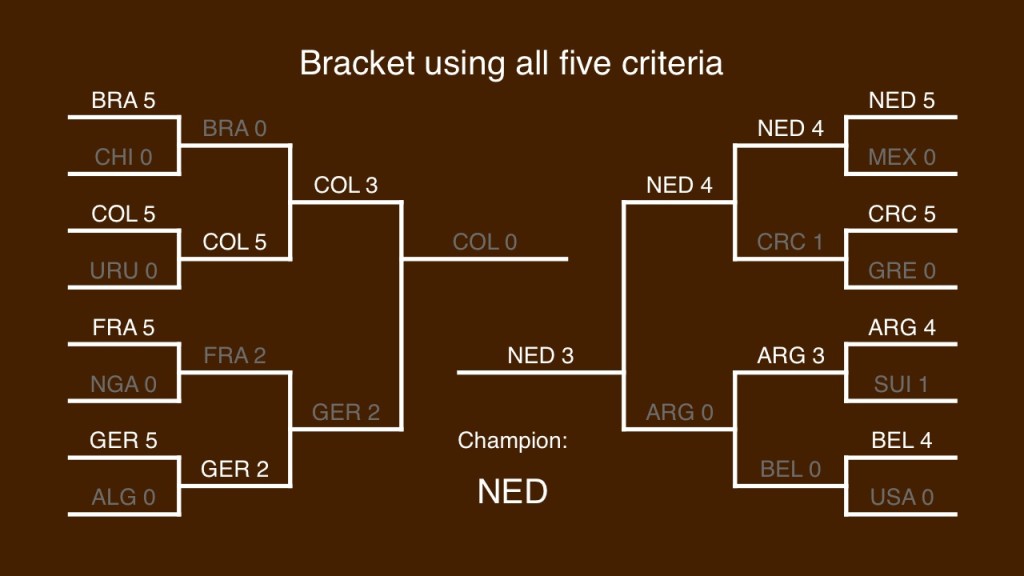
Five criteria
I used the first three determinants of standing in the group round (points, goal differential, goals for) and added my two weighted criteria. Whichever competitor “won” more match-ups would advance.
I had one tie, between France and Germany in the quarterfinals. I gave the win to Germany based on its better weighted performance.
Weighted criteria only
Because I created the “weighted” scores to attempt to capture strength of schedule, I felt going with those alone would be a good test of their worth.
I had two ties. I gave Costa Rica the edge over the Netherlands because CRC amassed fewer points in the opening round (and thus had less of a chance to rack up bigger weighted scores).
In the finals, I went with Germany over Costa Rica because they had better GD and GF data (they were square on points).

Discussion
Both models are subject to a very limited data set: just three games for each team. As such, they are not very reliable as a proxy for long-term success — particularly in a single game of soccer.
The weighted criteria, paired with the small set, give an edge to the first-place teams in each group. Both models have all of the group winners advancing over the second-place teams.
Colombia over Brazil in both. We saw Chile take Brazil to penalties (and almost won late in extra time). Maybe?
I like the looks of the first model. The second model (weighted only) is more questionable — Costa Rica in the finals? Seems a bit farfetched from what I understand. But then again, as we’ve seen in this Cup, anything is possible.
What do you think?